Cave Creek Home Real Estate Appraisals
Cave Creek Appraisals
Sun Point Appraisals, Inc.® completes home and commercial appraisals throughout the city of Cave Creek, AZ. The main office of Sun Point Appraisals, Inc. is in North Scottsdale just outside of Cave Creek. We have been performing Home Appraisals in Cave Creek, AZ for the over 18 years. ORDER HERE NOW
Cave Creek Arizona has a variety of luxury custom high end homes, horse properties, condominium housing and single family residences. In addition to residential real estate Cave Creek has several unique shopping centers and small office complexes throughout. Cave Creek is a town in Maricopa County. According to 2006 Census Bureau estimates, the population of the town was 4,951.
There is a vibrant rustic somewhat touristy Cowboy downtown which revs up with the Winter visitors. Stop into one of the oldest Dairy Queen locations, which is also one of the busiest in the state. Sun Point has been appraising Cave Creek since 1999.
Geography
Cave Creek is a small town located in the Sonoran Desert of Arizona, with an elevation that is 2129 feet above sea level. Many great outdoor activities like hiking, biking or art hunting can be had in this town. Beautiful golf courses, world-renowned dining and shopping opportunities are in the plenty. The town of Cave Creek becomes busy on the weekends, especially in the Winter months.
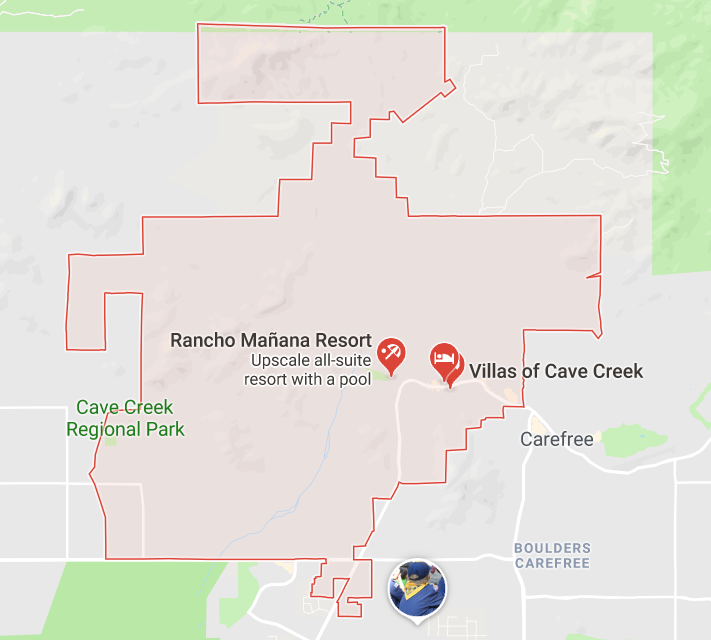
According to data compiled by the United States Census Bureau, the town of Cave Creek has a total area of 28.2 square miles.it is all land. It is next to the town of Carefree, Arizona. In 2000, Maricopa County, and the town of Cave Creek bought Spur Cross Ranch, a 2,154-acre tract of Sonoran desert just North of Phoenix, for $21 million. It had unusual cacti, stone formations, and hundreds of Hopi Indian tribal artifacts, and is now a Maricopa County park.
Demographics
As of the census of 2000, there were 3,728 people, 1,571 households, and 1,101 families residing in the town. The population density was 132.0 people per square mile. The racial makeup of Cave Creek was 94.98% White, 0.30% Black or African American, 0.19% Native American, 0.43% Asian, 0.05% Pacific Islander, 2.60% from other races, and 1.45% from two or more races.
There were 1,571 households out of which 27.1% had children under the age of 18 living in the home, 59.0% are married couples living together, 7.4% had a female householder with no husband present, and 29.9% were non-families. 24.3% of all households were made up of individuals and 6.2% had someone living alone who was 65 years of age or older. The average household size was 2.37 and the average family size was 2.80.
In the town the population was spread out with 20.9% under the age of 18, 5.5% from 18 to 24, 24.2% from 25 to 44, 36.1% from 45 to 64, and 13.3% who were 65 years of age or older. The median age was 45 years. For every 100 females there were 100.1 males. For every 100 females age 18 and over, there were 97.5 males.
The median income for a household in the town was $59,938, and the median income for a family was $76,549. Males had a median income of $50,399 versus $31,607 for females. The per capita income for the town was $38,070. About 6.0% of families and 7.7% of the population were below the poverty line, including 12.9% of those under age 18 and 7.3% of those age 65 or over.
Real Estate
For more information on Cave Creek real estate and for an appraisal please contact our office. (480) 595-0188
Market Trend as of 05/31/2018
Statistical Market Analysis
| Status | # Listings | List Volume | Sold Volume | List Price | Sold Price | Sale/List Price | Approx SQFT | List Price Per Approx SQFT | Sold Price Per Approx SQFT | Agent Days on Market | Cumulative Days on Market | |
|---|---|---|---|---|---|---|---|---|---|---|---|---|
| Active | 261 | 208,970,026 | 0 | Low Avg Med High |
199,000 800,651 648,000 5,600,000 |
0 0 0 0 |
0.00 0.00 0.00 0.00 |
600 3,215 3,108 10,159 |
89.95 257.33 216.49 1,959.69 |
0.00 0.00 0.00 0.00 |
0 135 83 1,596 |
0 151 91 1,596 |
| CCBS (Contract Contingent on Buyer Sale) | 11 | 5,741,190 | 0 | Low Avg Med High |
334,900 521,926 415,900 1,099,000 |
0 0 0 0 |
0.00 0.00 0.00 0.00 |
1,782 2,530 2,034 4,488 |
168.56 202.97 203.37 244.88 |
0.00 0.00 0.00 0.00 |
21 114 71 442 |
21 114 71 442 |
| UCB (Under Contract-Backups) | 51 | 30,064,299 | 0 | Low Avg Med High |
264,900 589,496 480,000 1,500,000 |
0 0 0 0 |
0.00 0.00 0.00 0.00 |
1,383 2,809 2,470 5,431 |
118.98 208.26 202.89 399.68 |
0.00 0.00 0.00 0.00 |
6 102 67 529 |
5 110 80 529 |
| Pending | 55 | 30,641,647 | 0 | Low Avg Med High |
223,000 557,121 499,000 1,500,000 |
0 0 0 0 |
0.00 0.00 0.00 0.00 |
1,024 2,722 2,539 5,072 |
135.24 203.81 197.23 372.67 |
0.00 0.00 0.00 0.00 |
0 85 53 591 |
0 112 63 710 |
| Closed | 924 | 464,283,401 | 450,772,774 | Low Avg Med High |
89,000 502,471 449,000 2,297,000 |
82,000 487,849 440,000 2,000,000 |
0.24 0.98 0.98 1.09 |
650 2,515 2,390 7,432 |
102.92 199.83 193.97 625.00 |
59.32 194.57 190.15 592.11 |
0 92 65 564 |
-1 100 66 912 |
| Overall | 1,302 | 739,700,563 | 450,772,774 | Low Avg Med High |
89,000 568,126 479,450 5,600,000 |
82,000 487,849 440,000 2,000,000 |
0.24 0.98 0.98 1.09 |
600 2,675 2,486 10,159 |
89.95 211.88 197.14 1,959.69 |
59.32 194.57 190.15 592.11 |
0 101 66 1,596 |
-1 111 70 1,596 |
Selection Criteria for Comparable Properties
Specified listings from the following search: Property type Residential; Status of 'Active', 'Closed', 'Pending','CCBS (Contract Contingent on Buyer Sale)','UCB (Under Contract-Backups)'; Zip Code like 85331; Close of Escrow Date between '05/1/2017' and '05/31/2028'.
Fannie Mae 1004MC Statistics
| Inventory Analysis | Prior 7-12 Months 5/31/2017 - 11/30/2017 |
Prior 4-6 Months 12/1/2017 - 3/2/2018 |
Current - 3 Months 3/3/2018 - 5/31/2018 |
|---|---|---|---|
| Total # of Comparable Sales (Settled) | 432 | 170 | 245 |
| Absorption Rate (Total Sales/Months) | 72.00 | 56.67 | 81.67 |
| Total # of Active Listings | 195 (Active on 11/30/2017) | 235 (Active on 3/2/2018) | 322 (Active on 5/31/2018) |
| Months of Housing Supply (Total Listings / Ab. Rate) | 2.71 | 4.15 | 3.94 |
| Median Sale & list Price, Dom, Sale/List % | Prior 7-12 Months | Prior 4-6 Months | Current - 3 Months |
| Median Comparable Sale Price | 437,500 | 424,655 | 460,000 |
| Median Comparable Sales DOM | 69 | 64 | 64 |
| Median Comparable List Price | 539,900 | 625,000 | 621,950 |
| Median Comparable Listings DOM | 197 | 146 | 90 |
| Median Sale Price as % of List Price | 98.00 % | 98.00 % | 98.00 % |
| Prepared by Angie Johnson | All information should be verified by the recipient and none is guaranteed as accurate by ARMLS. DND2 ( D o N ot D isplay or D isclose) - the data in fields marked with DND2 is confidential, for agent use only, and may not be shared with customers or clients in any manner whatsoever. |
05/31/2018 2:49 PM | © 2018 ARMLS and FBS. DMCA |